Statistics
Under the "Statistics" tab, you get a comprehensive overview of the total charging in the area along with associated prices. The information can be filtered by month, quarter, or year.
The amount displayed as "Credit" is what is paid out via self-invoicing. "Discount" shows the total discount amount if users have charged at a reduced price. "Debt" means that the area has a debt to ChargeNode, which can occur if charging frequently takes place at a discount or if the charging price is too low to cover ChargeNode's fee.
The information can also be exported to Excel.

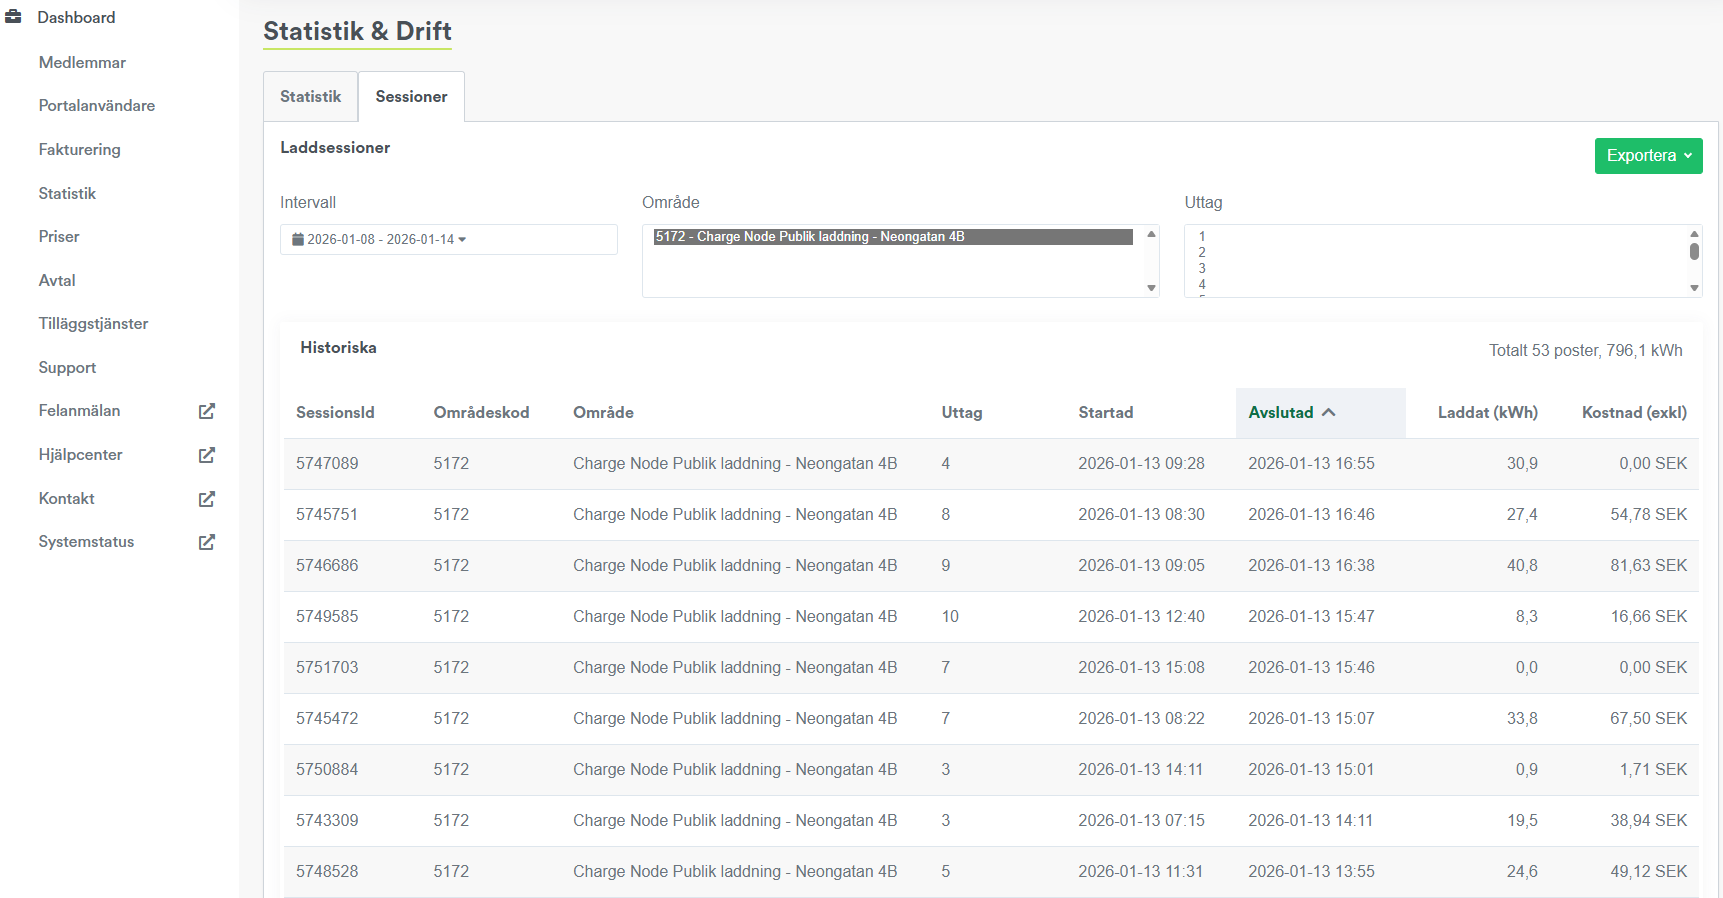
Sessions
Under the "Sessions" tab, you will find more detailed statistics. There is an option to filter the information based on different time intervals, areas, and outlets. This data can also be exported to Excel. The statistics contain all charging sessions at the outlet level and can be used as a basis for your own analyses, such as calculating the utilization rate.